Posted on June 15, 2021
Summary
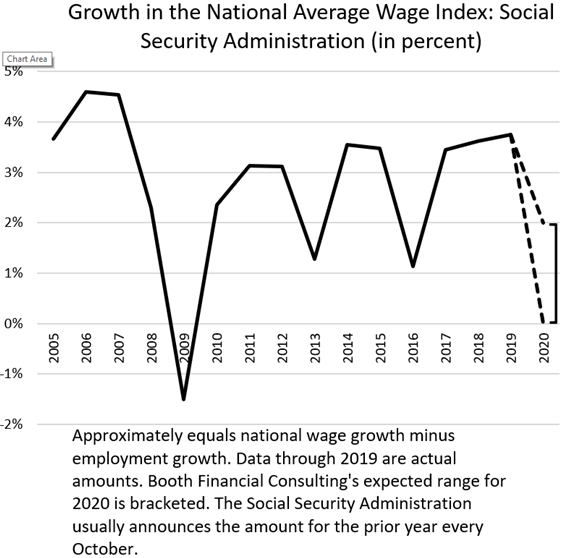
- My best estimate at this point is that the national average wage index (AWI) for Social Security purposes rose by about 1 percent in 2020, which would be a much better performance than some experts’ projections last year for a significant decline, and better than the small 0.5 percent decline estimated most recently (in January) by the Congressional Budget Office (CBO). A reasonable range for my estimate of AWI growth for 2020 would be somewhere between flat and a 2 percent increase. As more and more information becomes available about economic activity in 2020, our estimate of the AWI has been rising.
- The average wage index affects Social Security benefits, the maximum amount of wages subject to Social Security taxes, and other parameters of the Social Security system. It’s particularly important for calculating the future benefits for people turning age 60. The measure is calculated by the Social Security Administration. Growth in the AWI is basically the difference between growth in aggregate wages and salaries for the year and growth in the number of employed workers. Workers are counted as employed for that purpose if they worked at any point in the year, even for a very short duration. SSA will announce the AWI results probably in October.
- Most of the uncertainty in the measure for 2020 appears to be on the employment side of the calculation. We have a good sense of where economywide wages were in 2020, but the unique measure of employment for AWI purposes makes for a good bit of uncertainty in its movement during a downturn.
The national average wage index (AWI), as the name implies a measure of average wage and salary earnings in the economy, is used in the determination of Social Security benefits and the maximum taxable wage base, among other elements of the Social Security System. As we learn more about economic activity in 2020, it is looking less and less likely that the AWI fell from 2019 to 2020. The Social Security Administration (SSA) will tabulate information from tax filings and announce the AWI probably in October. We estimate that the AWI rose by about one percent in 2020, with our likely range–admittedly a wide one due to the very unusual 2020 year–between flat and an increase of 2 percent (see chart below). That wouldn’t be so far outside of the normal movements. Any increase would be relatively good news for people who turned 60 in 2020, because the AWI in the year a person turns 60 has an outsized effect on a worker’s future Social Security benefits. Projections last year, during the worst of the recession, were for decreases in the index in 2020, perhaps very significantly so. The last projections we’ve seen are from the Congressional Budget Office back in late January, when it estimated a decline in the AWI of 0.5 percent; that was a big improvement from the 3.8 percent decline the agency estimated last September. Here at Booth Financial Consulting, less than three months ago in March, we estimated that the index would be roughly flat in 2020. As more and more information becomes available about economywide wages and salaries in 2020, our expectation for AWI growth keeps getting larger. We now see flat growth as the bottom of our range, and an increase in the AWI is most likely. Now let me lay out the case.
The average wage index is calculated, in effect, as total wages and salaries in the economy divided by the total number of employees, and is calculated by SSA from W-2s filed by employers for tax reporting purposes. Thus, growth in the AWI roughly equals the growth in wages and salaries minus the growth in the number of employees. So, we break our estimate of the AWI movement into those two pieces, first taking wages and salaries.
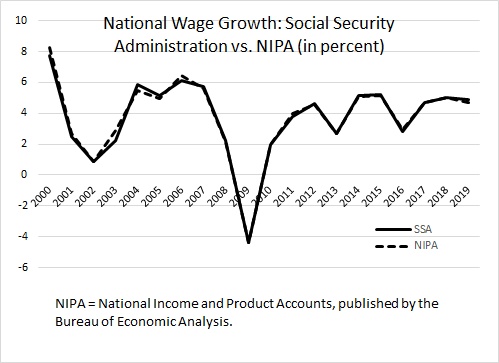
Over the past 20 years at least, growth in wages and salaries as estimated by SSA has lined up remarkably closely with growth as measured in the National Income and Product Accounts (NIPAs), even though the two measures use different data sources (see chart below). Perhaps they line up so well because both data sources are from administrative records–SSA using W-2s, NIPAs using reports from employers used by governments to administer the unemployment insurance system–that cover nearly the entire economy, rather than samples of the economy. In any event, it looks like we just need a good measure of NIPA wage growth in 2020 to project the SSA measure of wage growth.
We are expecting that NIPA wage and salary growth will end up being 1.5 percent for 2020, although that is not what the NIPAs are currently showing. We posted a week and a half ago how recent data from the Quarterly Census of Employment and Wages (QCEW) imply that NIPA wage growth for 2020 will be revised up in late July to 1.5 percent from its current measure of 0.7 percent. We recognize, though, that 2020 was such an unusual year that if significant deviations between the NIPA and SSA measures are ever going to appear, 2020 would probably be the year. But we’re pretty confident that we now have a good grasp on part 1 of estimating the AWI for 2020, namely the total wage component.
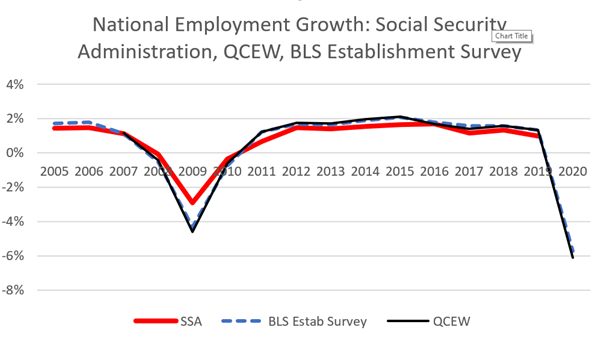
Estimating employment growth for AWI purposes is more difficult. Employment for AWI purposes is the number of employees who received W-2s, regardless of how much they worked. Because employers are required to issue W-2s to all of their employees for the year, even if they worked for just a day, the AWI concept of the number of employees is rather unique. The AWI measure of the number of employees should, and does, vary much less than the average number of employees at any point in the year, like we get from using the establishment employment survey or the QCEW (which also measures employees along with wages). For example, during the recession in 2009, the AWI employment measure dropped much less than did the average number of employees as reported in the establishment survey and QCEW (see chart below).
Because the pandemic-induced recession started in earnest in March 2020, that means that most workers, working in January and February at least, would end up in the AWI measure and we won’t see the drop that we observe in other employment measures like the establishment survey and QCEW. But how much employment in the AWI drops in 2020 is the big question. We infer from CBO’s reports that they expected a 0.8 percent increase in employment for AWI purposes, which is just slightly below the 1.0 percent increase in 2019. I’ve said before that I wouldn’t be surprised if the increase was smaller, or perhaps there was a decrease. For example, the Bureau of Labor Statistics has reported that employment of younger workers aged 16 to 24, much representing high school and college students, was 17.5 million in July 2020, compared to 23.3 million in July 2019. Of those lost jobs, some share probably represents students who weren’t employed at all during the year–being in school before and after the summer and not working while in school. Is that amount enough to move the needle on aggregate AWI employment? The same can be said for workers, some two million or so, who were already long-term unemployed in early 2020. Did many of them leave the labor force completely and not work at all in 2020, at least more than in a normal year? It’s those groups that give me pause in expecting an increase in AWI employment in 2020 that is close to what we saw in 2019. If there are timely, useful data sets to address the issue, like the Census Bureau’s Current Population Survey, which tracks individuals through the year, I haven’t seen anyone use them for this purpose. Please let me know if you know how to address the question.
So, I get an expectation of about 1.0 percent increase in the AWI by combining expected wage growth of 1.5 percent and employment growth of 0.5 percent. Or perhaps wage growth was 0.7 percent, as in the current NIPA measure, and employment growth was also 0.7 percent; amounts like that would yield my lower bound estimate of flat growth in the AWI in 2020. On the other side, perhaps wage growth was 1.5 percent and employment for AWI purposes fell by 0.5 percent; that would yield an increase in the AWI of 2.0 percent, my upper bound.
The next data point is whether NIPA wages and salaries really are revised up late next month. But most of the public information regarding the AWI is in and we’ll just have to wait and see what SSA tabulates and reports probably in October.