Posted on July 29, 2022
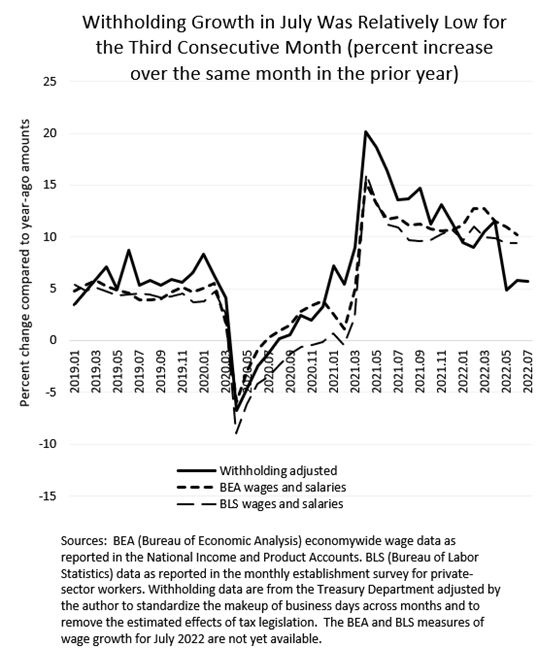
We’ve now had three consecutive months with relatively slow growth in federal tax withholding–the amount of federal income and payroll taxes withheld from workers’ paychecks and remitted to the U.S. Treasury Department. We estimate that tax withholding grew by 5.7 percent in July (compared to the amounts from July of a year ago), just about the same as the 5.8 percent year-over-year growth in June and just a bit higher than the 4.9 percent in May (see chart below). (See our methodology for how we construct those measures, which involves using the daily withholding remittance amounts reported by the Treasury and removing the estimated effects of tax law changes (currently a relatively small adjustment) and standardizing the makeup of business days across months.) That recent amount of withholding growth is relatively low compared to both the 9 percent to 12 percent range that withholding grew from January to April, and to recent growth in wages and salaries as measured by the Bureau of Labor Statistics (BLS) in its monthly establishment survey of private-sector workers and by the Bureau of Economic Analysis (BEA) as a part of its GDP accounts. Growth in tax withholding is also low relative to consumer price inflation, implying that economywide wages are not keeping up with consumer prices, a different story than one gets from the BLS and BEA data. We will not address here whether the relatively low amount of withholding growth adds weight to the likelihood that the economy is currently in recession.

The BLS measure for July will become available at the end of next week, but year-over-year growth in private-sector wages and salaries as measured by BLS has been in a pretty narrow band of 9 percent to 11 percent for more than a year, albeit at the lower end of that band recently; it doesn’t seem likely we’ll see an abrupt decline in July. The tax withholding data tends to roughly track the BLS measure, but differences can occur.
We may need to wait a while for more comprehensive data to become available from the BLS’s Quarterly Census of Employment and Wages (QCEW) to see if the tax data are anomalously indicating significantly slowing wages or if the establishment survey is missing something. Unfortunately, the QCEW data do not become available until about five months after the end of a quarter, so we get the first quarter data in late August and the second quarter data three months after that. When the QCEW data become available, they are used by BEA to measure wages and salaries for the GDP accounts, but BEA largely uses the BLS establishment data in the meantime.
We won’t address the question of the day for the U.S. economy, which seems to be whether the economy is currently in recession or not. Does the withholding data add weight to the likelihood that the economy is in recession? Perhaps we’ll address that in another post. I think the answer is maybe, maybe not, but it gets complicated because it involves differences in measuring overall economic activity from the product side (from consumer spending, business investment spending, and other spending), versus measuring overall activity from the income side (from wages, profits, and other incomes). Although measuring overall activity from either the income or product sides should be the same, they are never identical because of measurement differences, and currently the income side is measured as being unusually large compared to the product side; that would need to get unpacked.