Posted on February 21, 2021
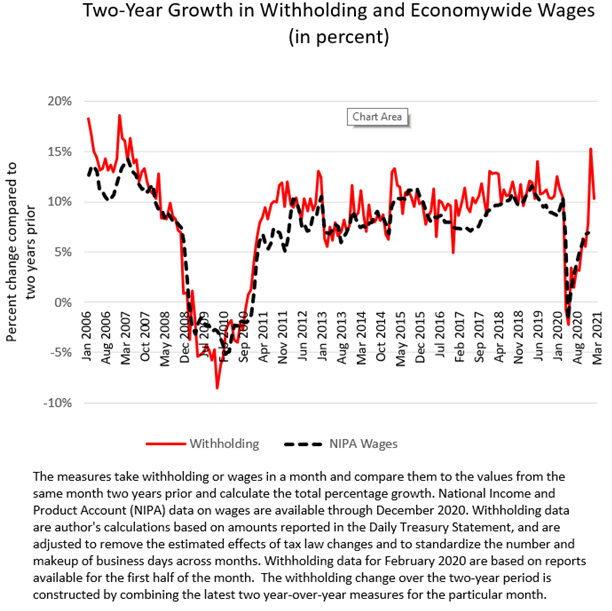
We’re coming up on a year now since the pandemic caused shutdowns and the severe economic contraction. Here we address the purely measurement implications of that one-year mark on how we assess the current income and payroll tax withholding data. The way we normally measure withholding growth is on a year-over-year basis, comparing withholding in comparable daily periods in the current and previous year. Starting in March, but especially in April, comparisons to year-ago amounts will become difficult to interpret. In April, year-over-year withholding growth should jump sharply just because withholding last April was so low and the economy has now recovered to a significant extent. Year-over-year percentage growth potentially measured in the teens will be difficult to interpret in isolation. So, we’ll be introducing the year-over-two-year growth measure (see chart way below) as a way to continue to monitor in an understandable way how withholding is doing during the economic recovery. We’ll also continue to estimate the standard year-over-year measure of growth.
Basically, comparing withholding in April of this year with April of 2019 (and the same for later months) will enable us to see back past the recession and address the question of how much economywide withholding–and by extension economywide wages and the overall economy–has returned to its path if the pandemic and recession had not occurred. It’s not all that different from how macroeconomists measure the GDP gap–how much GDP in recessions has fallen short of where it would be if the economy had continued to grow at its normal rate given standard growth in labor and capital inputs and productivity.
Looking at the history of year-over-two-year growth in withholding and wages buttresses the argument that the overall economy has recovered substantially over the past year, much more of a “V-shape” than in the financial crisis of the 2008-2009 period (again, see chart below). It isn’t a real sharp V-shape recovery, as clearly many people have been left far behind in the recovery, and the “K-shape” recovery description certainly has much merit, but that characterization is beyond the scope here. In any event, the latest economywide wage data from the National Income and Product Accounts (NIPAs) estimates that two-year growth through December 2020 (that is, from December 2018 to December 2020) totaled about 7 percent. Two-year withholding growth was about the same. Prior to the pandemic and recession, basically starting after the recovery from the financial crisis, we saw two-year withholding growth of around 10 percent to 11 percent, give-or-take in certain years. That is equivalent to about 5-1/2 percent growth per year on average. So, by December 2020, overall withholding taxes (with two-year growth of 7 percent) had made it back to about two-thirds of the way to where they would have been if the economy had continued to grow at about 5 to 6 percent over each of the past two years (for about 11 percent growth combined over the two years). We also have withholding data for January and part of February, and the January withholding data showed a big surge–but one we discussed in a past post was likely temporary and not indicative of a true surge in the economy. It shows up as a big jump at the end of the chart, and withholding in February has continued strong, but less so than in January. It is quite possible that two-year NIPA wage growth by February will be more than two-thirds of the way to where it would have been without the recession. If and when it gets back to 100 percent, basically that implies that economywide wages will have returned to where they would have been without the recession.

A natural question for economists to ask is why limit the measurement of withholding growth to a year-over-year calculation (or by extension, the year-over-two-year version)? Unfortunately, the withholding data are extremely volatile on a day-by-day basis, both because of the rules governing when firms must remit the tax amounts withheld from their workers paychecks, and because the calendars change from month to month and year to year. Normal seasonal adjustment methods when applied to the raw, volatile withholding data do not yield stable, reliable measures–trust me, I and wiser people have tried. Similarly, estimating the effects of the different calendars, while doable and resulting in better measurements than seasonal adjustment, still do not yield as stable and reliable estimates, we conclude, as does our method of calculating year-over-year withholding growth (see a description of our method). We come to that conclusion because our measure of withholding growth, done on a year-over-year basis, correlates much better with comparably-measured monthly NIPA wage growth than do any seasonally-adjusted or other types of withholding measures we can estimate–such as the raw withholding growth adjusted for estimated effects of calendar differences. But year-over-year measures of withholding growth lose information on the changes from one month to the next; it doesn’t matter in a year-over-year measure if, in the period between the two months being compared, the series went way up and then down, or way down and then up (as we are currently experiencing).
So, we introduce the year-over-two-year growth measure as a way to monitor the tax withholding data in an understandable (hopefully) way as we enter year two of the recession. The advantages of the withholding data–being available more timely than direct wage measures and yet highly correlated–lead us to believe they can still be very useful in providing a gauge on economywide wages and salaries despite the year-over-year measurement issue.