Posted May 18, 2020
Summary
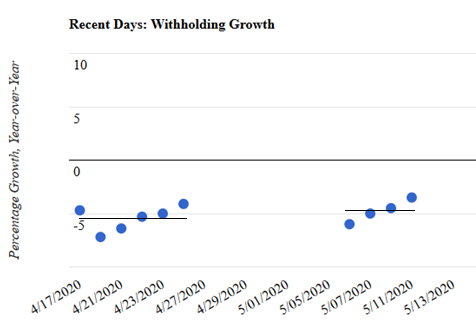
- We estimate that tax withholding fell by 4.7 percent, measured on a year-over-year basis, in the first half of May, compared with a 5.4 percent decline in the second half of April. That suggests that overall wage income has roughly stabilized. Withholding growth historically has tracked economywide wage growth.
- The slight recent improvement in withholding growth is most likely just statistical noise.
- An economy moving roughly sideways would be consistent with other very current economic indicators.
- We get measures of filtered daily withholding growth for each of the four business days before Memorial Day, but none for the remainder of the month.
We now have data on tax withholding for the first half of May, and it suggests that withholding, and thus economywide wages, have stabilized after falling rapidly in March and especially so in April. We estimate that withholding growth, on a year-over-year basis, fell by 4.7 percent in the first half of May, just slightly better than the 5.4 percent year-over-year decline recorded in the second half of April (see chart below). Given the unusually large variability in our daily measurements, that slight improvement is most likely just statistical noise. The measures of withholding growth are adjusted to remove the estimated effects of tax law changes, most importantly provisions of the CARES Act that allows businesses to delay remitting payroll taxes.

An economy moving roughly sideways would be consistent with some other economic indicators. Many measures of economic activity are lagged to a degree that they measure what happened several weeks ago or longer, rather than what has happened very recently. One very current composite indicator, though, is the Weekly Economic Index (WEI) put together by Professor James Stock of Harvard (and former member of the Council of Economic Advisors), Daniel Lewis (New York Federal Reserve), and Karel Mertens (Dallas Federal Reserve). The WEI synthesizes 10 weekly indicators of economic activity, including initial and continued unemployment insurance claims, railroad traffic, and, among other measures, our filtered tax withholding measure. The WEI, which historically has closely tracked monthly industrial production and the four-quarter change in real GDP, also seems to suggest an economy currently moving sideways. Wage income, proxied by tax withholding, is clearly tremendously important in measuring people’s economic well-being, but such income–representing more than 40 percent of total GDP measured from the income side–does not measure the entire economy. And the withholding measure is only a proxy for wage income. Thus, it is important to assess many measures of economic activity.
A look at the recent daily measurements of withholding growth (again, see chart) shows an unusual pattern in the past two half-month periods of a generally larger drop initially which is then followed by progressively smaller declines. The variability in the daily measurements in recent weeks has been larger than normal, which is not surprising given the recent economic upheaval. That specific pattern of systematic movements up (or down) has not existed historically, and I don’t have an explanation. If it persists, it will warrant a close examination. In any event, we average the daily measurements for each half of the month when assessing the data.
We start getting new daily measurements of filtered withholding growth in the middle of this week, and we’ll see what they show. We’re currently in the normal mid-month period when we cannot get good measures of withholding growth because of large, highly variable mid-month withholding payments (see methodology). The Memorial Day holiday a week from now will then further limit our data measure, because the payment effects of holidays and the immediate aftermath make it very difficult to reliably measure withholding growth. Combined with the normal month-end period when we cannot get acceptable results by filtering the daily withholding data, that means that we get a withholding measurement for each of the four days before Memorial Day, but not thereafter this month. That last daily measure, for the Friday before Memorial Day, becomes available on the Tuesday after Memorial Day, because the withholding data from the Treasury Department are always released one business day after the amounts are remitted.