Posted on August 31, 2023
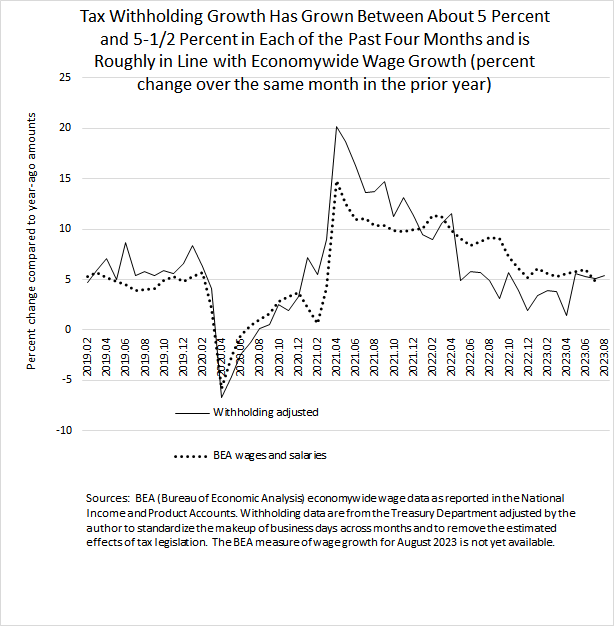
We estimate that federal tax withholding–the amount of income and payroll taxes withheld from workers’ paychecks and remitted daily to the U.S. Treasury–grew by 5.4 percent in August (compared to the amounts from August 2022). That is the fourth consecutive month with withholding growth of between 5.1 percent and 5.6 percent (see chart below). It’s reminiscent of the period in the summer and fall of 2019, before the pandemic, when withholding growth was stable for five consecutive months at just a little higher level–between 5.4 percent and 5.9 percent. Our measure of withholding growth adjusts the actual amount of withholding to remove the estimated effects of tax law changes (with no such adjustments needed this year) and to standardize the calendar across months.
We’ll see what is shown by the employment report for August that will be released by the Bureau of Labor Statistics (BLS) tomorrow–ahead of the Labor Day weekend; certainly the tax withholding data don’t suggest any significant slowdown in employment, but the month-to-month movements in employment as measured by the BLS establishment survey do not move in a tight relationship with the tax withholding data. That occurs for several reasons: employment is just a part of overall wage and salary growth, which also includes changes in average hourly earnings and hours worked per week. But even overall wage and salary growth as measured in the employment report–which includes changes in average hourly earnings and hours worked–does not move in lockstep with tax withholding. Withholding growth can change independently of wages–and thus does not closely approximate wage growth–if the wage distribution changes significantly among taxpayers in different income tax brackets, and workers can change their withholding without regard of their wages to account for other tax liabilities, such as those stemming from capital gains realizations. On the other hand, the BLS wage measure excludes income from bonuses, which can be an important source of wage variation (and is subject to tax withholding), and the BLS establishment survey covers only roughly 30 percent of all employees, while the withholding data cover nearly all employees.
Withholding growth in recent months is in line with recently-available data on economywide wages (including salaries) from the National Income and Product Accounts as measured by the Bureau of Economic Analysis (again, see the chart below). Economywide withholding and BEA-measured wages tend to move together, but they can deviate, such as they did for about a year until May of this year when economywide wages were measured to have grown a good bit faster than withholding. Unlike the BLS measure of wages from the establishment survey, the BEA measure of wages is based on administrative data that cover nearly all employees. However, the BEA data are subject to subsequent revisions, sometime substantial ones, as it takes time for that administrative data to become available and be incorporated into the wage data. We expect that the BEA measure of wages and salaries for 2022 will be revised down in late September by between 0.5 to 1.0 percentage points, closing some of that gap between withholding and wage growth. But we expect much of the gap–about a couple of percentage points or so–to remain. We believe that wage distributional shifts, in which lower-income workers had faster growth in wages, explains some of that remaining gap between wage growth and withholding growth.
