Posted on February 7, 2021
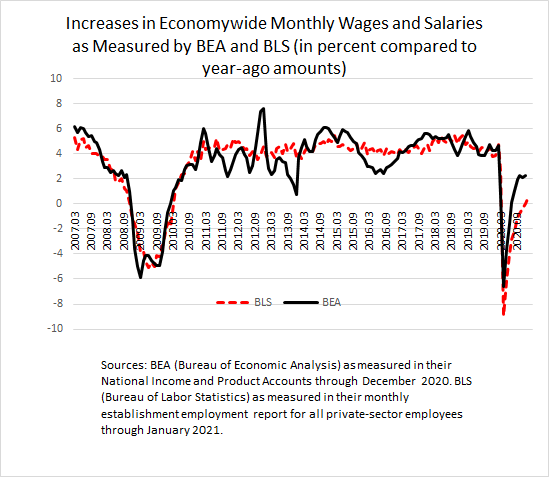
We won’t let Super Bowl Sunday stop us from posting, so let’s get right to it. Having a gauge on how economywide wages and salaries are doing is important, especially during the recovery from a recession, and we are currently getting somewhat different signals from the Commerce Department’s Bureau of Economic Analysis (BEA) and the Labor Department’s Bureau of Labor Statistics (BLS). Specifically, BEA-measured wages and salaries (as reported in the national income and product accounts) are recovering more quickly than those measured by BLS. In the data for December, BEA measured total wage and salaries as 2.3 percent above the amount from December of a year ago, while BLS measured exactly zero growth in total private-sector wages (see chart below). (BLS has preliminary data available through January showing 0.6 percent growth. BEA will not have data through January until the end of this month.) I don’t have the answer yet as to which measure is providing a better read of the current state of wages and salaries in the economy.

Significant deviations between the two measures have popped up from time to time through history, as seen in the chart. Indeed, because the data in the chart include all revisions, the pre-revised amounts could often show even bigger deviations that later get revised away. That raises the question of whether we will see downward revisions to the recent BEA data or upward revisions to the BLS data, or if the observed deviation will remain. The BEA data are subject to more substantial revision (than the BLS data) because the BEA source data, from the BLS Quarterly Census of Employment and Wages (QCEW), are from a completely different source than what BEA uses in the meantime. The BLS revisions tend to be more modest. That would argue for some likelihood of a downward BEA revision to the wage data.
The QCEW data for the third quarter of 2020 are scheduled to be released in a few weeks, so we’ll get a sense of whether the BEA data will be revised as a result. But the usefulness of that information is reduced because the data are always so lagged.
One item of possible difference in the two measures of economywide wages, whether the government sector is included or not, doesn’t appear to be a story in the current deviation. The most aggregate measure available from the BLS monthly establishment survey covers just the private-sector, while BEA also includes the government sector. The measures in the chart above thus have different coverage. But even when we put the measures on an apples-to-apples basis, just looking at the private sector, the current deviation remains (see chart below). Indeed, the deviation between the growth in private-sector wages and salaries from BEA and BLS is a little bigger than that between BEA total wages and BLS private-sector wages.

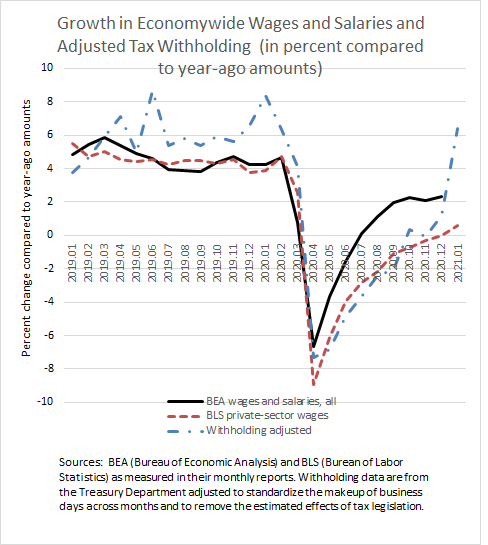
We use remittances of tax withholding from employees’ paychecks as a very real-time proxy for economywide wages and salaries. Through the 2020 economic decline and partial recovery, withholding tended to track the BLS measure much more closely than it tracked the BEA measure (see chart below). Toward the end of 2020, the tax withholding measure started moving more in between the BEA and BLS measures. So, the tax withholding data had been more consistent with the BLS measure, but not as much very recently. (The January measure of tax withholding growth, at 6.4%, was anomalously high, as described in a previous post.)

The BEA measure of wages and salaries after all revisions are made is generally considered a better measure than the BLS measure because the BEA measure is based on administrative data––that is, amounts required to be reported to the federal government by all employers––rather than being based on a sample of employers, such as the BLS establishment employment survey. Nonetheless, the BEA data in the near-term, before the revisions to reflect the QCEW data, are not nearly as reliable because of often substantial revisions.
Interestingly, BEA uses the BLS establishment survey as its basis for wage and salary data before the QCEW data are available. That raises the question of why the BEA and BLS measures of wage growth could deviate so much in recent months. The likely culprit is adjustments that BEA makes to the BLS establishment data, for example to incorporate the government sector that is left out of the establishment survey. But as shown above, even the private-sector-only measures of BEA and BLS can deviate substantially. I have never been able to figure out the sources of the deviations in the measures in the period before the QCEW data become available. It is possible that coverage differences could contribute. For example, the BLS measure of wage growth intentionally omits bonus payments and income from stock option exercisings, while the BEA measure of wages and salaries does include those sources of income, at least eventually when the QCEW data are incorporated.