Posted on November 22, 2022
Happy Thanksgiving Week to you. Every three months the Bureau of Labor Statistics (BLS) releases data on employment and wages from the Quarterly Census of Employment and Wages (QCEW) for the quarter ending about five months earlier, so definitely backward looking. Today BLS released the partial QCEW data for the second quarter of 2022. The complete report is scheduled to be released on December 6, but we can tell from the partial release that growth in economywide wages and salaries in the second quarter appears to have slowed more than indicated by the comparable data from the National Income and Product Accounts (NIPAs). In particular, we estimate that wages and salaries in 2022Q2 as measured by the QCEW grew by about 8.4 percent compared to that from a year ago, in 2021Q2, which is a little over a percentage point slower than the 9.6 percent growth currently measured in the NIPAs (see chart below). We pay attention to the QCEW data both because they are based not on a sample but instead on administrative records–reports filed by most all employers for purposes of state and federal government administration of the unemployment insurance program–and because the QCEW data are the main, eventual source of data on wages and salaries in the widely-used NIPAs. The weaker QCEW data compared to the NIPA data on wages and salaries suggest the possibility that the NIPA data will be revised down for the second quarter (and for the third quarter) in the release scheduled for Wednesday of next week.
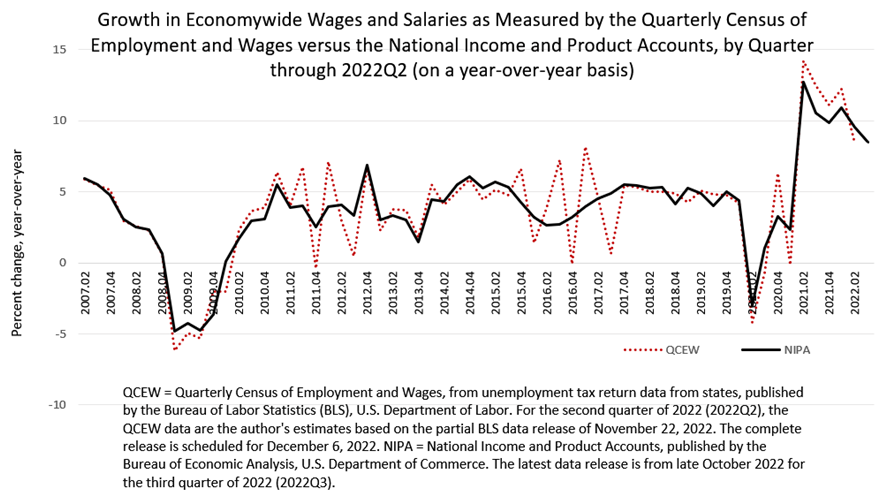
The QCEW data are high quality in terms of coverage, but they can be very volatile on a quarter-to-quarter basis, making them an unreliable indicator of near-term NIPA updates–as I’m trying to assess here. The QCEW data are volatile mainly because the calendars between years can be different, for example more or fewer business days or different ones in a quarter compared to the same quarter in the prior year. The volatility tends to be largest in the first and fourth calendar quarters, but can occur anytime in the year (again, see the chart). For example, if a quarter has an extra payday, like a Friday, compared to the same quarter of the prior year, then the QCEW data may show a boost in wages that is artificial. Such a boost would tend to work in the opposite direction in the next quarter, and that up-and-down, quarter-to-quarter pattern can be seen in the data–but irregularly enough that we find the data to be useful to analyze. The Bureau of Economic Analysis, in using the QCEW data to revise the NIPA measure of economywide wages and salaries, makes adjustments to the QCEW data in an attempt to standardize them for different calendar effects. The adjustment methodology is not publicly-available as far as I know. It is much the same challenge faced when we adjust the federal tax withholding data for monthly differences in calendar effects. Note that because the calendar effects embedded in the QCEW average out over a year, we find that the QCEW wage data for an entire year line up very closely with the corresponding NIPA measure for a year–but at this point we have just 2 quarters of QCEW data for 2022.
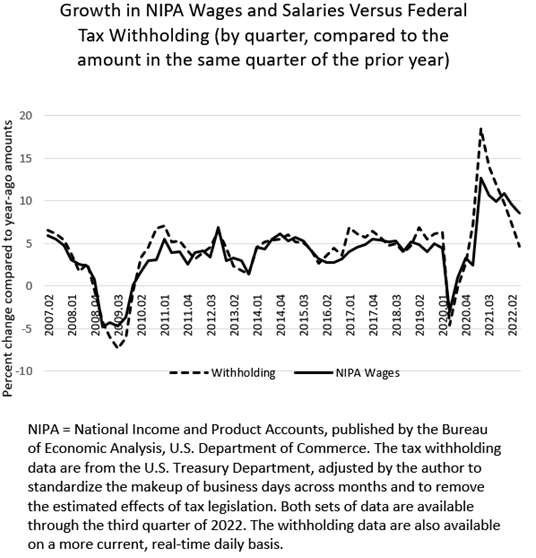
We have previously observed that growth in federal tax withholding–amounts of income and payroll taxes withheld from workers’ paychecks and remitted to the U.S. Treasury Department–dropped significantly starting partway through the second quarter of 2022, and has been well below reported growth in NIPA wages ever since (see chart below). For the second quarter of 2022, tax withholding grew by an estimated 7.4 percent, compared to 9.6 percent growth in wages and salaries in the National Income and Product Accounts. (And the difference is even larger for 2022Q3, at 4.6 percent and 8.5 percent, respectively). In the past we have noted that one of the possible explanations for the difference is that NIPA wage growth could be revised down when the more comprehensive QCEW data became available. It does not appear likely that a downward revision for 2022Q2 will explain all of the deviation between withholding and NIPA wage growth, but we’ll see next week if the incorporation of the QCEW wage data into the NIPAs brings wage growth down closer to the amount of tax withholding growth.