Posted on February 24, 2020
Alright, this may be a bit in the weeds—perhaps well into the weeds—but I see no evidence from available data that the Bureau of Economic Analysis (BEA) this summer will be substantially revising overall wages and salaries for 2019 as measured in the National Income and Product Accounts (NIPAs). That conclusion stems from my analysis of both withholding growth in 2019 and three quarters now of administrative data on wages for 2019 from the Department of Labor’s Bureau of Labor Statistics (BLS). The third quarter data just became available last week. We’ll have a much better estimate for NIPA wage revisions when additional data from BLS become available in three months.
Why do we care about overall wages and salaries in the economy? Overall wages and salaries in the economy, as measured in the NIPAs and by other measures that are more delayed, are important for both monetary and fiscal policy purposes, and less directly as a measure of workers’ living standards. If overall wages are rising, then businesses face rising labor costs, which may reduce their profits or get passed along to consumers as higher prices. If the higher wages stem from productivity increases, though, then profits and prices may be unaffected. Those are all important factors for the Federal Reserve to consider in its conduct of monetary policy. Furthermore, if overall wages are rising, then income and payroll taxes paid by workers increase, which directly affects the federal government’s fiscal condition, measured by the federal deficit. Wages and salaries are the largest and highest taxed source of income in the economy. Overall wages, however, are less useful in measuring the living standards of an average worker for a number of reasons, including that movements in wages of higher-income workers can dominate the measure. Nonetheless, total wages can give some indication of movements in wages of average workers.
Different Measures of Overall Wages. Every July BEA revises its historical measure of overall wages and salaries, especially the data for the previous year when better information becomes available from the Quarterly Census of Employment and Wages (QCEW), compiled by BLS. The QCEW data are especially valuable because they are administrative data, meaning they are not based on a sample, but rather on information required by law to be reported by most employers in the country for purposes of administering the federal-state unemployment insurance system. The QCEW covers about 95 percent of total jobs in the country. Those QCEW data lose some value, however, both because they are not available until roughly five to seven months after the wages are paid and they are quite volatile (more on that later). This past Thursday BLS released the QCEW data for the third quarter (July-September) of 2019.
By contrast, the wage data from the BLS monthly establishment employment survey are available much more quickly than the QCEW data, within several days after each month is over (although they can be revised a lot later). Withholding tax data, an indirect measure of overall wages but based on administrative data, are available even quicker than that. Other administrative measures of annual overall wages, such as from income tax return filings and W-2 tax reporting, are available much more slowly than even the QCEW data.
Revisions to NIPA Wages. The NIPA wage data are initially estimated from the establishment employment survey, but then are revised as information from the QCEW become available. When all four quarters of the QCEW data for the prior year become available every May, then we can tell much more closely what the revisions for the NIPA wage data for that year will be when two months later BEA releases its annual July updates.
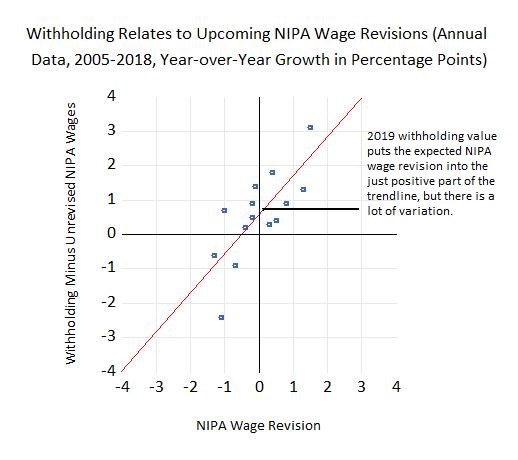
You might think, like I did, that three quarters of QCEW data would give a better indication of upcoming NIPA revisions than would the withholding data for the full year, but that doesn’t appear to be the case. My estimates suggest that withholding growth is a much better indicator, although the withholding-NIPA revision relationship is not tight (see chart). The QCEW data, however, suffer from significant timing issues related to payroll dates around the beginning and end of quarters (much like the withholding data on a monthly basis for which we try to correct); as a result, the quarterly QCEW values can bounce around a lot, especially in the fourth quarter of the year.
This time, both the QCEW and withholding data are suggesting that the NIPA revision for 2019 probably won’t be significant, which I define as at least a half of a percent in either direction (which has occurred in eight of the past 14 years). Certainly, a substantial revision, which I define as one percent or more in either direction, which has occurred in five of the past 14 years, doesn’t seem very likely at all. NIPA wages are currently measured as growing 4.9 percent in 2019, while the QCEW data for the first three quarters of 2019 grew at a 4.6 percent rate (compared to the same three quarters in 2018), thus close to the currently-estimated growth in NIPA wages for the full year. Withholding growth for 2019 was higher at 5.8 percent, but it includes some real bracket creep (in which increases in real income push more income into higher tax brackets) and a measurement anomaly for one month of 2019 (in which it appears that the daily tax withholding data were overstated and that became apparent when the official full month’s Treasury report subsequently became available). Real bracket creep means that withholding should normally grow somewhat faster than overall wages in a growing economy. In any event, both the QCEW data and the daily tax withholding data are not suggesting significant NIPA wage revisions for 2019. But in May, when the final quarterly QCEW data for 2019 are released, we’ll have a much better idea of the impending NIPA wage revisions.