Posted on March 15, 2021
We learned more from the Quarterly Census of Employment and Wages (QCEW) for the third quarter of 2020 that was released on Tuesday of last week by the Bureau of Labor Statistics (BLS). The QCEW data are administrative data on employment and wages collected from nearly all employers by the state governments in their role in administering the joint federal-state unemployment insurance program. The wage and salary data for the first three quarters of 2020 overall line up pretty closely with what we see from the National Income and Product Accounts (NIPAs), compiled and released by the Bureau of Economic Analysis (see chart below). That suggests that there is no obvious revision coming to 2020 NIPA economywide wages and salaries, though there is still one more quarter of QCEW data to go for 2020. There are some differences in what the QCEW and NIPA data show so far for the different quarters of 2020, so that raises some questions about what the QCEW data will show for 2020Q4 when released in mid-May and early June.
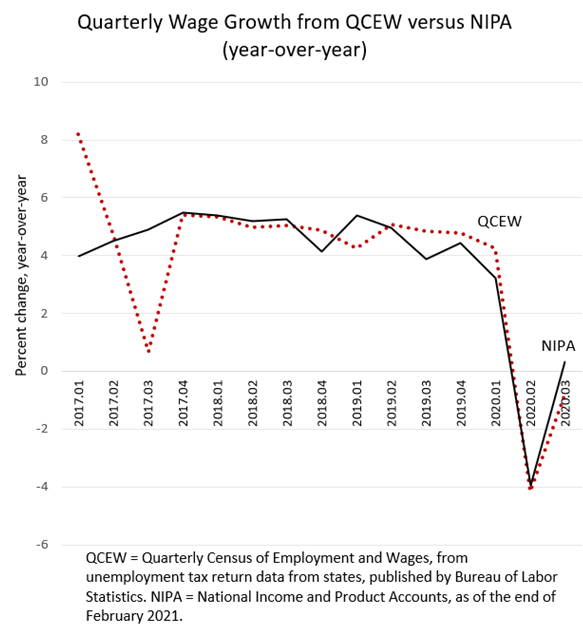
In particular, NIPA wages and salaries for the first three quarters of 2020 were down by 0.1 percent compared to the same three quarters of 2019, the same rate of decline as in the QCEW data. NIPA wage growth was a bit stronger than QCEW growth in 2020Q3, but QCEW wages and salaries were a bit stronger than NIPA wages in 2020Q1. It’s not a big surprise that the two measures are lining up over the nine-month period, because the QCEW data are the most important input into BEA’s calculation for the NIPAs. Because of the delay in availability of the QCEW data, BEA uses the monthly establishment report from BLS as its main input into NIPA wage estimates for the most recent 4-5 months, but then incorporates the QCEW data when they become available. Although it is not a surprise that the data from the two sources are lining up, it isn’t always the case.
As we thought was quite possible after looking at the preliminary QCEW data for 2020Q3 released last month (and as we discussed in a previous post), the NIPA wage data for 2020Q3 were revised down in late February. As of late January, wages in the NIPA data were estimated to be growing 1.1 percent in 2020Q3 relative to the same quarter in 2019, but that growth was revised down to 0.3 percent in the late February NIPA release.
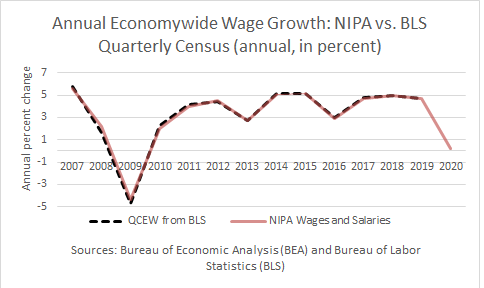
The QCEW and BEA data on wages don’t always line up closely every quarter, but they do by the end of the year. On an annual basis, wages and salaries in the NIPAs line up very closely with the QCEW data (see chart below). Because the 2020Q4 NIPA wage data are still subject to much revision, it won’t be until the late May 2021 NIPA release that we see the final lining up. We should be able to tell in mid-May, when the preliminary QCEW data are released for 2020Q4, pretty closely where the NIPA wage data will be for 2020. That will have implications for the average indexed wage measure that is important for Social Security purposes, but more on that in a separate post.
At the moment, BEA has wages and salaries growing at just 0.2 percent for the full 2020 calendar year–basically flat although with large swings through the course of the year. The difference between wage growth as measured by the QCEW and NIPAs in 2020Q3, with the QCEW showing a year-over-year decline of 0.8 percent and the NIPAs showing the small gain of 0.3 percent, does raise a question as to how the final measurement of 2020Q4 will end up. (Although not exactly on point, we’ve posted recently how different measures are giving some different signals about current wage and salary growth.) NIPA wages for 2020Q4 are still subject to much revision, and if NIPA wages in 2020Q4 end up growing like BLS’s measure of total private-sector wages from the monthly establishment survey, which is currently available and are down 0.4 percent (compared to 2019Q4), then BEA wages would be very close to flat for the year, as in the current BEA estimate. Again, that congruence with the current BEA estimates shouldn’t be a surprise since BEA uses the monthly establishment survey for its very recent wage estimates. However, there have been years in which that congruence hasn’t been the case.
So, there is still a bit of uncertainty as to what the QCEW report will show for 2020Q4. The QCEW is a great data source because it is administrative data–data required to be reported to government authorities and thus typically subject to sanctions for misreporting–covering about 95 percent of total jobs in the economy, rather than being based on a sample like the monthly establishment survey. However, the QCEW data suffer from significant timing issues related to payroll dates around the beginning and end of quarters (much like the withholding tax data for which we attempt to correct for). As a result, the quarterly QCEW data can occasionally bounce around a lot. BEA attempts to correct for those timing issues when they incorporate the QCEW data into the NIPAs. BEA also adds estimates for employment not covered by the unemployment system and hence not in the QCEW data.