Posted on November 22, 2020
Every three months the U.S. Bureau of Labor Statistics (BLS) releases quarterly data on employment and wages for the quarter ending about five months before, so a bit of a lag. We pay attention to those data from the Quarterly Census of Employment and Wages (QCEW) both because they are based not on a sample but instead on administrative records–reports filed by most all employers for purposes of the states and federal government administering the unemployment insurance program–and because the data are the underlying, eventual source for the data on wages and salaries in the widely-used National Income and Product Accounts (NIPAs). This past Wednesday BLS released its incomplete QCEW data for the April-June quarter, so the initial quarter with the effects of the pandemic. From the incomplete data–as always, the complete data become available in a couple of weeks–we can very loosely infer that maybe, possibly, NIPA wages will be revised down slightly for the second quarter in the release scheduled for Wednesday of this week. But it’s a big maybe for two reasons.
The first source of uncertainty is that the incomplete QCEW data include just one month of employment data, so we’ll need to adjust for that. The change in employment plus the change in average (per-worker) wages yields the change in total wages in the economy. BLS provided a full quarter estimate of the average wage change, with average wages higher by 8.6 percent in the second quarter compared to the second quarter of 2019. It was up so much, as in other measures of average wages in the economy, because of a major shift in employment away from lower-wage workers as a result of the pandemic. Employment, on the other hand, dropped, and by much more than the average wage rose, but all we see currently from the QCEW is that employment in June was down 9.4 percent–very close to the 9.1 percent year-over-year decline for the month in the BLS monthly establishment survey of all private-sector employers. From other data, such that same BLS establishment survey, we know that employment was down a lot more in April and May than it was in June.
If we estimate the employment change in April and May for the QCEW as being the same as what BLS reported in its monthly establishment survey for all private-sector workers, then QCEW-measured employment for the second quarter would be down by about 12.4 percent for the quarter. (We’ll know the QCEW employment results for April and May in early December, but that will be after the November NIPA revision, so waiting would take away all the fun with predicting the revision.) So, with average wages up by 8.6 percent and employment perhaps down by 12.4 percent for the quarter, that generates my estimate of QCEW total wages in the economy being down by 4.9 percent (year-over-year) for the quarter (see chart below). That is very close to the 4.6 percent decline currently carried in the NIPAs based largely on the BLS establishment survey. The difference would be about $25 billion (annual rate), or a 0.3 percent downward revision to the NIPA measure. We’ll see if the NIPA wage amounts to be released this week, which will incorporate the complete QCEW data for the second quarter, will be revised like that.
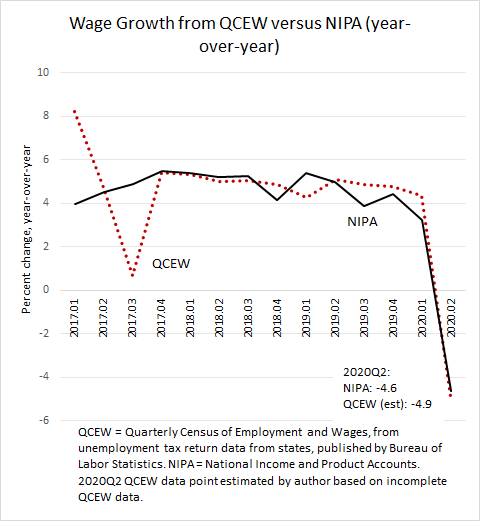
The second, bigger uncertainty, though, is that the QCEW data only often, not always, line up with the NIPA change, which makes the QCEW an unreliable indicator of near-term, quarter-by-quarter NIPA updates–like what I’m trying to do here. For example, the data have lined up somewhat closely from the fourth quarter of 2017 to the first quarter of 2020, but there were major differences in the first and third quarters of 2017 (again, see the chart). Data going back further also have occasional major disjoints. The main source of those disjoints is that calendar differences between years can have significant effects on the QCEW data. In the underlying reporting, employers just provide data on all wage payments in the quarter. If the quarter has an extra payday, like a Friday, compared to the prior year’s same quarter, then the growth rate between quarters can be significantly affected. (It actually looks more like a difference in the timing within the quarter of the paydays, rather than the number, is the key.) In any event, when the Bureau of Economic Analysis puts together the NIPA data, it makes adjustments to the underlying QCEW data to standardize them for different calendar effects. The adjustment methodology, as far as I know, is not publicly available. It is much the same problem that we have when we adjust tax withholding for calendar effects. Although the concept is the same, the calendar effects on withholding are different because most employers remit withholding the day after they pay their workers; for QCEW purposes, they do not have that one day reporting lag. Maybe someday I’ll try to infer the BEA adjustment mechanism for wages, but definitely not today.
Although the QCEW releases are unreliable for predicting near-term NIPA revisions, they are excellent at predicting the annual, end-July NIPA revision for the previous year–for example see our previous post from May. That is because over four quarters the calendar effects on the QCEW data wash out. But during the year, we don’t know how the calendar is affecting the data. Indeed, BEA doesn’t really know either, hence one of the primary reasons that the NIPA wage data for the previous year get revised every July, sometimes substantially.
Interestingly, we have found the withholding tax data–the primary determinant of which is overall wages in the economy–to be a better near-term indicator of eventual NIPA wage revisions than other, more direct wage measures (see analysis here). But once the full year’s worth of QCEW data become available in May after the year is over, then we pretty much know the upcoming July NIPA wage revision for that prior year. And what does the withholding data say about possible revision to the second quarter NIPA wages? It suggests a bigger downward revision than the QCEW data show, as withholding on a constant law basis, as we measure it, was down by 6.3 percent in the second quarter compared to the second quarter of 2019, so more of a drop than the 4.9 percent drop I estimate for the QCEW. But I suspect that even if the withholding data are giving a better signal on what the NIPA wage amounts should be, we won’t find out until the NIPA revision next July.