Posted on April 5, 2021
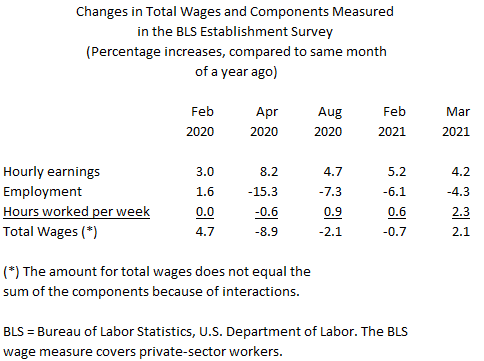
Employment and wage data for March, released by the Bureau of Labor Statistics (BLS) on Friday of last week, showed a pop up in both employment and wages. Private-sector wages as measured by the BLS establishment survey jumped to 2.1 percent above March 2020 amounts, after being down by 0.7 percent on that year-over-year basis in February (see chart below). Wages as measured by BLS in March did not grow anywhere near the recently high growth rates indicated by tax withholding (see previous post on withholding growth in March, and some possible reasons for the higher growth rates), but both measures moved up significantly in March. Wages as measured by BLS and by the Bureau of Economic Analysis in the National Income and Product Accounts (NIPAs) had been giving different signals since the recession began, with the NIPA measure showing less wage deterioration than the BLS measure, but those signals lined up much better in January and February. We can expect a pop up in NIPA wages and salaries for March with the next NIPA release near the end of this month.

The BLS data allow us to disaggregate the increase in total wages in March into three components: hourly earnings, employment, and hours worked per week. (The number of employed workers times the average hours worked per week by a worker times earnings per hour yields a measure of total wage earnings per week.) The increase in year-over-year wage growth in March stemmed about equally from a smaller decline in employment and an increase in hours worked per week (see table below). The drop in employment has not occurred equally across sectors and types of workers in the economy, and the shifts have caused unusual monthly movements in hourly earnings and hours worked per week. The average workweek doesn’t typically move very much over time, but when new workers are brought back into the employed ranks, and if those workers work longer hours on average, then you can get pops in hours worked per week like we saw in March, and the opposite, to a smaller extent, back in April 2020 when employment dropped sharply.

Starting this month, it will become difficult to interpret these year-over-year growth rates, as the base month becomes the very depressed levels from last year. We previously discussed the same phenomenon for the measure of tax withholding, in which we started looking at growth over the past two years–looking back to before the beginning of the recession–as a better way to interpret the degree of economic recovery.