Posted on April 29, 2021
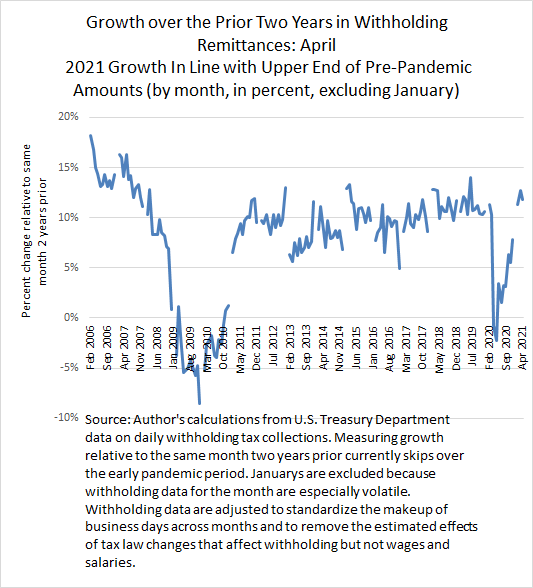
Tax withholding growth in April has remained strong. We measure that relative to withholding in April 2019–so two years ago–withholding was 11.8 percent higher (see chart below). That measure removes the estimated effects of tax law changes that affect withholding but not wages and salaries (estimated to be small on that year-over-two-year basis in April) and standardizes the makeup of business days across months. We use the year-over-two-year estimate to skip over the 2020 pandemic year and all the legislative effects on withholding that make a direct measurement more uncertain. That two-year withholding growth in April is somewhat less than the 12.8 percent growth estimated for March but a little above the 11.3 percent growth estimated for February. I wouldn’t place much emphasis on the relatively small up and down over that period from February to April. Withholding growth on a two-year-ago basis is in line with the upper end of two-year growth recorded before the pandemic–again, see the chart below–meaning that withholding appears to be roughly back to where it would have been without the pandemic and associated economic recession. That is certainly a bullish signal but one with limits. That relatively high level of withholding growth may to some extent reflect the overall unequal effects of the recession on taxpayers with lower and higher incomes. Although withholding includes payroll taxes paid to some extent by all workers, most of withholding represents income taxes that are paid primarily by middle- and higher-income workers; the inequality of the economic pain from the recession and recovery, in which lower-earning individuals (in particular racial minorities, individuals without college degrees, and women) have disproportionately borne the brunt of the economic pain and higher-income workers have in general fared less poorly or in some cases have made out quite well, may be reflected in overall withholding tax growth that is higher than it would otherwise be.

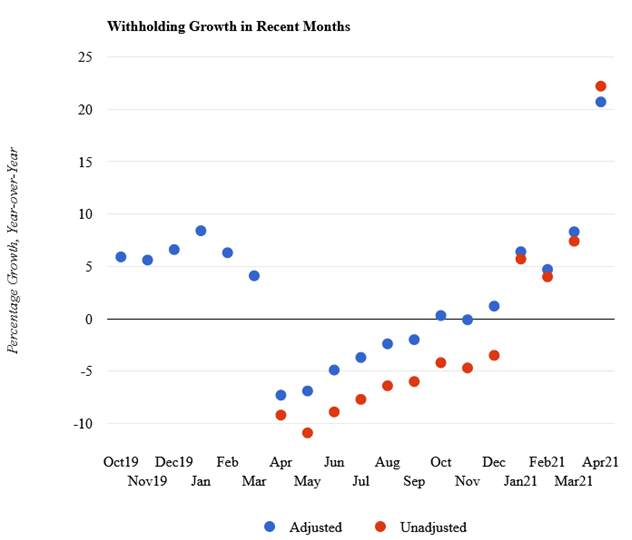
We’re used to looking at withholding growth on a more traditional year-over-year basis, in this case comparing to April 2020, but that measure is now giving signals that are very difficult to interpret. Comparing withholding in April of this year to that of the very depressed amounts in April of 2020 yields very strong growth rates–we estimate at almost 21 percent on a tax-law adjusted basis (and slightly more with the data unadjusted for tax law changes, see chart below). Many different monthly economic measures will also now starting showing very unusually high growth on a year-over-year basis. For withholding there is also the difficulty of measuring the effects of legislation in 2020. That issue is much less significant now when doing two-year-ago comparisons because the effects of legislation in 2020 do not matter. In particular, the deferral allowed for employers in remitting their share of Social Security taxes for 2020 may have been a bit larger than we have built into the legislative adjustments last year, according to a report recently released by the General Accountability Office (estimating $67 billion in such deferrals–perhaps including a small amount of employee deferrals also allowed–in the second and third quarters of 2020). That measurement issue doesn’t affect the 2021 two-year-ago comparisons because that deferral provision expired at the end of 2020–although the payback of the deferral, half of which must occur by December 31, 2021, will come back into play.

We’ll see what the National Income and Product Account (NIPA) estimates are for monthly wage growth through March, to be released tomorrow, and compare the results to withholding growth. NIPA wage growth estimates have recently been running well below withholding growth.