Posted on October 14, 2021
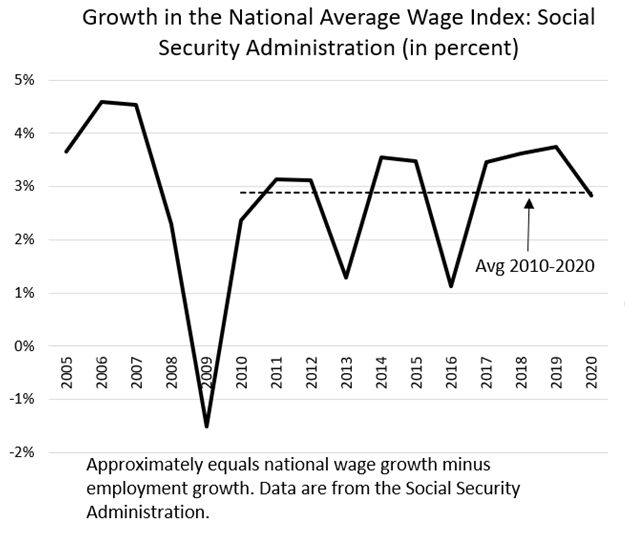
We’ve been tracking the average wage index (AWI) for Social Security for some time, ever since it looked like the index was going to take a big drop in 2020 as a result of the pandemic-induced recession. Such an outcome would have caused a big drop in future Social Security benefits for people turning age 60 in 2020. The Social Security Administration (SSA) released the AWI measure for 2020 yesterday, and instead of dropping, the AWI rose by about 2.8 percent in 2020, just about the average of the 2010-2020 period (see chart below). In this past recession and recovery, higher-income individuals generally have fared much better than others, and we believe that factor has significantly contributed to the AWI increasing in 2020 rather than falling as experts expected to occur and as it did in the previous recession. In our previous post on the subject, we expected the index to increase in 2020, but only by about 1 percent, so it increased more than even we expected. We’ve seen the gains of higher-income individuals boost tax revenue sources in multiple ways during this recession and recovery (see recent post), and here is another way in which the wage distributional shifts have skewed normal economic measures in the recession. And the AWI doesn’t just measure economic activity, it affects future Social Security benefits, especially for people turning 60 in that year, and also determines the maximum Social Security taxable wage base (in this case rising by 2.8 percent to $147,000 in 2022).
The national average wage index, as the name implies, is a measure of average wage and salary earnings in the U.S. economy. The average wage index is calculated, in effect, as total wages and salaries in the economy divided by the total number of employees, and is calculated by SSA from W-2s filed by employers for tax reporting purposes. (The W-2s for a year aren’t available until early in the subsequent year, so SSA has been hard at work tabulating the amounts that they just released for 2020.) Thus, growth in the AWI roughly equals the growth in wages and salaries minus the growth in the number of employees. SSA provides data for both sides of that equation, so we can see how, in gross terms at least, the AWI increased in 2020.
First, overall wages in the U.S. economy grew by an estimated 1.8 percent in 2020 according to SSA. That is a bit more than the 1.3 percent currently estimated in the National Income and Product Accounts (NIPAs), but the two measures of aggregate wages continued to track closely (see chart below). The NIPA data for 2020 have been completely available since July, and on a quarterly basis we have observed the ever-improving amounts of total wages as the overall economy started recovering after the pandemic-induced shutdowns that started back in March 2020. National wage growth in 2020 was nonetheless substantially lower than the roughly 5 percent growth recorded each year from 2017 to 2019. But national wage growth didn’t fall like in 2009, at the worst of the previous recession. And growth in wages in 2020 was still a bit more than the small increase in 2002, following the 2001 recession, even though the 2020 recession was much deeper than the one in 2001.

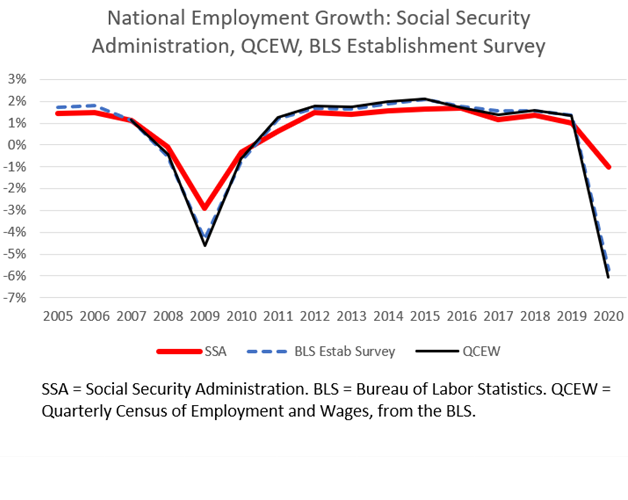
However, the overall economy recovering in 2020 and into 2021 does not mean it has recovered well for everyone. The number of individuals who earned any wages in 2020, and hence received a W-2 from their employer, declined by about 1.0 percent according to SSA (see chart below). That is better than average employment over the year as measured by BLS in its monthly establishment report–the big employment report usually released on the first Friday of the month–and by its more comprehensive Quarterly Census of Employment and Wages. By its nature, the SSA measure is more stable because it measures people who worked at any point in 2020, even for a very short duration, like in January and February of 2020 before the recession hit. But a 1 percent drop in the number of people who worked at all in 2020 is a big amount compared to what has typically been an increase of between 1 and 2 percent per year.
The combination of the 1.8 percent increase in total wages and salaries in 2020 and the 1.0 percent drop in the number of people who worked at all in the year generated the 2.8 percent increase in the AWI. As stated earlier, that is just about the average increase over the past decade, but as we have highlighted, the components of the change were anything but normal, as both total wage growth and the number of employees dropped.
We have seen from different data sources, including from different types of federal tax payments, that higher-income individuals did much better than lower- and moderate-income individuals in the latest recession and recovery. The AWI was boosted by the strong wage growth of the higher-income individuals, and was further boosted by some lower-wage individuals completely dropping out of the labor market. SSA provides some indication of this distributional shift by reporting the 2020 increase in the median wage (for technically a very slightly broader measure of labor compensation than just wages), which increased by only 1.1 percent, the lowest rate of growth since 2010. The math is such that the average wage grew faster (2.8 percent) than the median wage (1.1 percent) because the higher-income folks did substantially better than others. And the increase in the median wage itself is presumably due in part to many lower-wage individuals–be they students, long-term unemployed individuals, women raising children without child care options, service-sector workers, or others–not working at all in 2020 and thus dropping out of the calculations.
It’s looking like the AWI in 2021 will most likely increase above the recent average rate. Overall wages in the economy have been rebounding strongly in 2021. Again, higher-income individuals appear to be doing quite well overall, with evidence that employment of lower-wage workers has still been lagging way behind employment of others, although the wages of many of those lower-wage employees who are working may be rising. It seems too early to predict with much accuracy the 2021 average wage index, but perhaps after we get the third quarter NIPA report at the end of the month, we’ll start getting some early hints of the broad range of possible outcomes. It really won’t be until January 2022 that we can start zeroing in on the AWI for 2021.