Posted on April 14, 2020
Summary
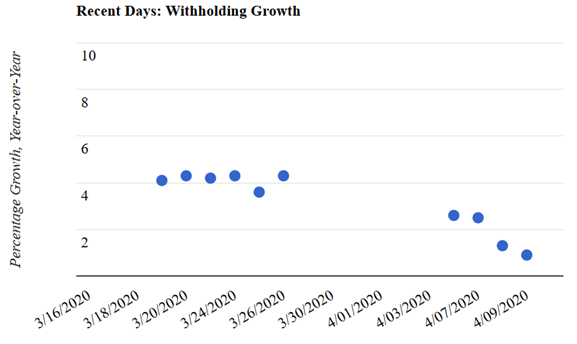
- Tax withholding growth continues to drop. In the first half of April, we measure withholding growth, which is a proxy measure for economywide wages, to have fallen to just 1 percent year-over-year, a drop of about 5 percentage points in just a month and a half.
- A decline of that amount in year-over-year terms implies a drop of roughly 4 percent in absolute terms over that six-week period. Although that is an annual rate of almost 30 percent, it still seems well short of what is really happening in the economy.
- I expect the measure to deteriorate much more over the next couple of weeks as it more fully reflects the effects of the stay-at-home orders. Looking at withholding over just the past week, the year-over-year growth rate is much worse, more like a decline of 10 percent on a constant law basis. The withholding growth measure we use has lags of a few weeks incorporated in order to remove noise that would otherwise typically dominate underlying movements over a period of a week or two.
- We get our next daily measures of withholding growth starting on Monday of next week, because growth measures around mid-month are unreliable.
Withholding growth has slowed considerably in recent days. The withholding growth measure that we estimate (see methodology) has fallen to just under 1 percent on a year-over year basis–that is, comparing the dollar amounts to those from the same period of a year ago (see first chart below). That measure also adjusts for the estimated effects of the recent law change in the CARE Act that allows employers to delay the payments of their share of Social Security taxes (see previous post); however, we expect the revenue-reducing effect of that law change on withholding , though substantial at about 15 percent, to phase in through April, and it is estimated as having small effects on the growth measure to date.

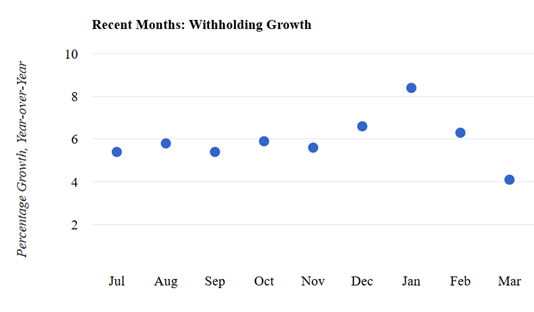
The decline in withholding growth, as we measure it, is substantial but still seems to be understating what is happening in the economy. Withholding growth has fallen from about 6 percent in February, where it was for much of the second half of last year, to less than 1 percent in the most recent period, a drop of about 5 percentage points (see second chart, below). A decline in the year-over-year growth of that amount is consistent with a roughly 4 percent drop in wages from late February to the first half of April (and yes, for you analysts, that is effectively seasonally adjusted). On an annualized basis that is a very large drop of almost 30 percent, but it is still “only” 4 percent over the six-week period. The 2007-2009 recession had a much larger peak-to-trough decline in the economy, albeit occurring over a much longer time period. Recent data such as claims for unemployment insurance, as well as a weekly measure of economic activity from Daniel Lewis, Karel Mertens, and James Stock (see their estimates), imply a much more severe recent decline in economic activity. It is also quite possible that the cutback in wages is disproportionately hitting lower-wage workers, which would keep withholding from dropping as much as wages and other economic activity.

I expect our withholding growth measure to deteriorate much more over the next couple of weeks as it more fully reflects the effects of the stay-at-home orders. Because the withholding data are so volatile–“noisy” as we say–we build lags of a few weeks into the withholding growth measure; that means it takes time for the measure to fully adjust to rapid shocks. Withholding in the past five days, for example, is showing substantial declines on the order of 10 percent, year-over-year and after adjusting for the estimated effects of law changes. Unless that turns around, I expect that we’ll be seeing significantly negative withholding growth rates, year-over-year, when we start getting withholding growth estimates again next week. Although the most recent five days have each been a good bit below the same day a year ago, and that looks like a representative period unaffected by calendar effects, usually the five-day data are much noisier and don’t lead to very meaningful interpretations. That latest five days is the first multi-day stretch in the past few weeks with such a consistent indication. Maybe the usual noise is still there but, unfortunately, is now being drowned out by a severe drop in the underlying wages and withholding.
We are now in the mid-month period in which we cannot get reliable measures of withholding growth. The middle of the month is when payments jump from small firms that are allowed to wait until then to make their withholding remittances on wages paid for the previous full month. (The largest firms, by contrast, remit withholding to the Treasury the day after paying their workers.) I estimate that the mid-month boost is less than 10 percent of the total amount of withholding for a month, so not overly large, but it still distorts the growth measures at that time. Because that mid-April payment will represent activity for all of March, including the first half of the month when much less of the economy was affected by the coronavirus response, the drop in that payment may not be as substantial as if it were reflective of more current conditions. That mid-month payment is, however, a relatively small part of total withholding payments for a month, so it shouldn’t have a big effect on the withholding growth measures that we will see next week.