Posted on May 22, 2020
Summary
- New BLS data on wages and salaries for 2019, which are the main data source used by BEA to update the National Income and Product Account estimates of wages and salaries, strongly suggest there will be only minimal revisions to the NIPA data for 2019 in the annual July updates.
- Although significant revisions to NIPA wages and salaries in July of at least 0.5 percent are common, the expectation for a minimal revision this time is no surprise given what we previously knew from three quarters of the BLS data and tax withholding for the entire year.
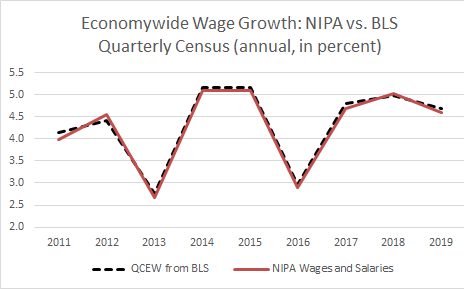
In a respite from data affected by the pandemic, we’ll look at data released on Wednesday by the Bureau of Labor Statistics (BLS) on wages and salaries for 2019. The data, from the Quarterly Census on Employment and Wages (QCEW), strongly suggest that this July we will not see major revisions to past data on wages and salaries as reported in the National Income and Product Accounts (released by the Bureau of Economic Analysis–BEA–in the Department of Commerce). Namely, according to the new BLS data for the fourth quarter of 2019, economywide wages and salaries grew by 4.7 percent in all of 2019, while the NIPA data currently show 4.6 percent growth. Because the main source of revision to the NIPA wage data each summer is to incorporate new QCEW information, it is no surprise that the revised NIPA data historically have closely tracked the full year QCEW data. (See the chart below for how closely the full year BLS wage data track the revised measure of wages from BEA. The lines are virtually on top of each other, even zoomed in some.) Hence, it is pretty clear that there won’t be a significant NIPA revision, which I define as one of at least 0.5 percentage points, which has happened in 8 of the past 14 years.

Who cares? Well, macroeconomists who forecast the economy certainly do, because it is hard to know where the economy is going if you don’t know where it has been. Wages and salaries, after all, are over 40 percent of GDP measured from the income side. Also, folks who forecast federal and state tax revenue care, given that wages and salaries are a key input into their forecasting models. More generally, people care because overall wages and salaries in the economy are important for both monetary and fiscal policy purposes, and less directly as a measure of workers’ living standards. And the reverberations of the wage data extend to items like Social Security benefits, something with more general interest, but that will have to wait until another post. Nonetheless, the data on activity from the past year is of much less interest now than usual, given the huge current economic disruptions from the pandemic.
So, BLS on Wednesday released the first administrative data on wages for all of 2019. These QCEW data come from unemployment insurance tax reporting that nearly all employers are required to provide quarterly to their states, who administer the unemployment program in concert with the federal government. Government administrative data, given the comprehensiveness and the backing of reporting laws, are generally superior to data generated from samples, such as in this case the monthly employment reports from BLS that get all the headlines. The cost is that we have to wait until almost five months after the quarter ends to get the QCEW data, so the data measure the economy roughly 4-1/2 to 7-1/2 months ago. And other administrative measures of wages for 2019, such as from tax returns, require even longer waits.
Now that we have the fourth quarter of 2019 wage data from BLS, we pretty much know the final NIPA wage growth for the year–and we foresee minor revisions at most to the current NIPA data. The NIPA wage data, released monthly, can’t wait for the QCEW data, so the NIPAs initially use the wage totals implied by the monthly employment report, and then revise the data when the QCEW data become available. The NIPA data fill in the roughly 5 percent or so of wages not covered by the QCEW, a portion that tends to be relatively stable and thus add few surprises to what the QCEW data show. For 2019, wages in the QCEW data grew by 4.7 percent, while wages in the NIPAs are currently showing 4.6 percent growth. That suggests very limited revisions to the NIPA data. In history, the NIPA data, as stated above, can often be revised by significant amounts (see discussion of NIPA wage revisions and tax withholding data).
Interestingly, using the first three quarters of QCEW data for the year and then extrapolating the fourth quarter can sometimes lead to poor estimates of wages for the full year; we need all four quarters of the QCEW data. The QCEW data can jump around from quarter to quarter because of calendar effects: a quarter may have more or fewer business days than in the same quarter of the prior year, and if the calendar difference is a major payday, then that can have significant effects. BEA attempts to adjust for the calendar effects when they use the QCEW data, but it can be quite difficult to adjust appropriately and they often can’t fix up the NIPA data until the annual July revision. (It’s much like the calendar effects we deal with when using the withholding tax data, although the specific calendar effects are different.) The tax withholding data can often tell us that NIPA revisions are forthcoming before the final QCEW data become available. However, we posted back in February, after the 3rd quarter 2019 QCEW release and with a full year of tax withholding, that a significant NIPA wage revision for 2019 was very unlikely. Now we’re even more sure.