Posted on June 9, 2022
We do not expect economywide wages and salaries as measured in the National Income and Product Accounts (NIPAs) to be revised upwards for 2021 when the Bureau of Economic Analysis–which compiles and publishes the NIPAs–undertakes its annual revisions in late July. We reach that conclusion from data released this week by the Bureau of Labor Statistics (BLS). But before we discuss that data, why do we care? One reason is that we probably need to look elsewhere than wages and salaries for the reason why federal income tax payments have been growing so rapidly in the current federal fiscal year–a good bit of which has stemmed from extremely strong growth in payments with 2021 tax returns filed in April (see previous post).
The Congressional Budget Office recently updated its federal budget projections from last year and now projects that if tax laws and other federal policies remain unchanged, individual income tax revenues this fiscal year (which ends on September 30) will rise by 28 percent and reach levels relative to the size of the economy that have never been seen since the federal income tax began in 1913. CBO provides lots of information about its projections and breaks out the likely sources of the fiscal year 2022 income tax growth, although the agency identifies that about a third of the expected growth is currently unexplained–that is, it cannot be explained by currently-available information on economic activity or by tax law changes that likely boosted revenue growth. It is common for the available economic data to not line up with income tax collections, and the information on economic activity that explains the movements in tax collections becomes available over time, sometimes up to a couple of years later as information from tax returns becomes available.
If economywide NIPA wages and salaries are not revised higher for 2021, that would remove one possible source of the unexplained growth in individual income tax revenues. It seems likely that much of the currently unexplained revenue growth lies in incomes that are particularly concentrated in higher-income taxpayers, such as capital gains realizations and business incomes, or from changes in the distribution of taxable incomes across taxpayers in which a higher share of wages and other income in 2021 was received by the highest-income taxpayers who face the highest tax rates.
As far as what we learned this week, BLS released its full report on how much overall wages and salaries were in the fourth quarter of 2021, as measured by the Quarterly Census of Employment and Wages (QCEW). The QCEW data are high quality in part because they are based on administrative reports provided by nearly all employers in order for the federal and state governments to administer the unemployment insurance system. Administrative data are generally much better than data from surveys because the administrative data are much more comprehensive. In any event, once we have the fourth quarter QCEW data, we can come very close to predicting how the NIPA data will be revised for that year.
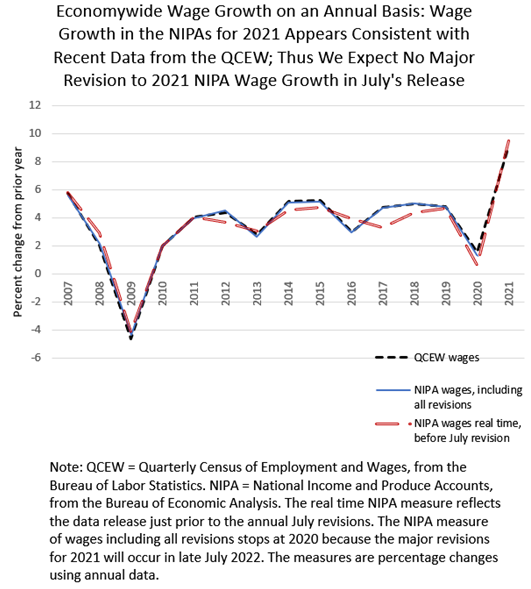
In short, growth in wages as measured by the QCEW typically lines up very closely with the revised amount of growth in economywide wages as measured in the NIPAs, not a surprise because the QCEW is the main ultimate data source for the NIPA measure of wages (see chart below). NIPA wages are currently estimated to have grown by 9.5 percent in calendar year 2021, which is close to the 9.1 percent growth that we see in the data from the QCEW (again see chart below). Annual growth in the 9 percent range is very high by historical standards, reflecting the bounceback from the recession in 2020 and the ramp up in inflation. But it is not anywhere close to the expected growth in individual income tax collections of nearly 30 percent this fiscal year. And if anything, the QCEW data suggest that wages in the NIPAs could be revised a bit lower for 2021, not higher that would help explain the surge in income tax receipts. Last year, when assessing the possibility of wage revisions for 2020, we identified that wages in the QCEW were growing faster than wages as measured in the NIPAs (pre-revision), and indeed the revised NIPA data released in July (the blue line in the chart) were higher than the unrevised data (the dashed red line). This year the QCEW and NIPA data are more in alignment, and if anything, as we say, a slight downward revision in the NIPA wage data would be more likely than an increase. Hence our search elsewhere for why federal income tax revenues are reaching record levels this year.