Posted on March 21, 2021
Summary
- There is still a lot of uncertainty, but my best guess at this point is that the average wage index (AWI) for Social Security purposes will be roughly flat in 2020, neither falling nor rising, which would be a better performance than projections by Stephen Goss of SSA and, much more recently, by the Congressional Budget Office (CBO), both of whom projected declines, albeit a very small one most recently in CBO’s case. A reasonable range for my estimate of AWI movement for 2020 would be somewhere between a 1 percent increase and 1 percent decrease.
- The average wage index affects Social Security benefits, the maximum amount of wages subject to Social Security taxes, and other parameters of the Social Security system. Growth in the measure is calculated by SSA as the difference between growth in aggregate wages and salaries for the year and growth in the number of employed workers. Employed workers for that purpose are counted if they worked at any point in the year, even for a very short duration. The Social Security Administration will announce the results of their calculations probably in October.
- The uncertainty of where the AWI will end up seems mostly to be on the employment side of the calculation. Data from the National Income and Product Accounts through all of 2020 give us a good sense of economywide wage growth–currently measured as roughly zero growth in 2020. The employment side is tougher to estimate because the number of people who work at least one day in a year varies less than the number of people who work for longer periods and is difficult to get measures of in real time.
- The employment uncertainty seems to be one-sided. I don’t think we can rule out a drop in 2020 employment, as measured for AWI purposes, instead of the small increase or flat growth that I infer the experts are expecting in their point estimates. If the decline is large enough, that could mean that the AWI will actually increase closer to what we’ve experienced in recent years.
There’s been a lot of concern that the national average wage index (AWI) will fall in 2020, perhaps by a lot, which would be a significant burden on people who turned age 60 in 2020 because of the way initial Social Security benefits are calculated. (See my previous post from last year for more details of the effect on people who turned 60 last year.) Because economywide wages have rebounded relatively quickly since the economic free-fall in April, a potential decline in the AWI doesn’t look to be as dire as once thought. Indeed, I think there’s still a good chance the AWI could end up rising slightly–but there is still a lot of uncertainty, and we won’t know the final answer until the Social Security Administration (SSA) releases the tabulation probably in October. My best guess is that the AWI for 2020 will remain about the same as in 2019. That would be a lot better than the 5.9 percent decline projected in rough terms back last summer in Congressional testimony by Stephen Goss of SSA–which recognized the uncertainty involved and was estimated before the economy, and wages in particular, bounced back in the second half of the year. And my best guess of rough stability would be just slightly more favorable to future Social Security beneficiaries than the Congressional Budget Office’s recent projection of a 2020 decline in the AWI of 0.5 percent. My range of likely outcomes would be between a 1 percent increase and a 1 percent decrease in the AWI for 2020.
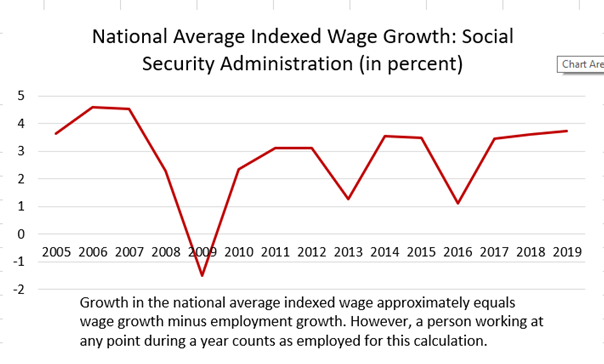
The average wage index is calculated as, in effect, total wages and salaries earned in the economy divided by total employees, calculated by SSA from tax return information (W-2s filed by employers). Growth in the AWI series, therefore, is approximately equal to the growth in economywide wages minus growth in the total number of employees. The AWI grew between 3.45 percent and 3.75 percent each year from 2017 to 2019 (see chart below). The last decline was in 2009 during the recession brought on by the financial crisis.
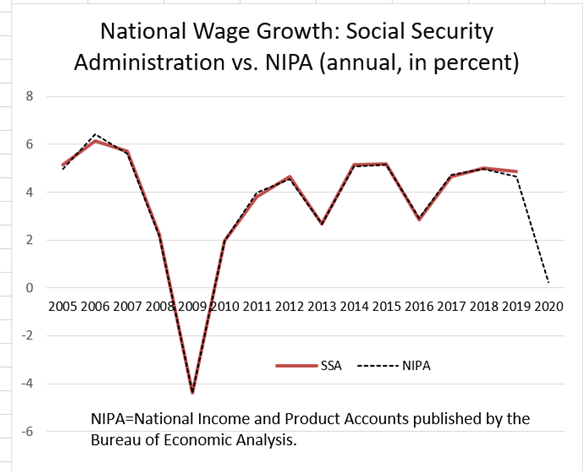
The first part of the AWI calculation, growth in economywide wages and salaries, has lined up very closely with data available from the National Income and Product Accounts (NIPAs) compiled by the Bureau of Economic Analysis (BEA) (see chart below). The NIPAs use different data than SSA uses for the AWI, but there has been little difference in the growth rate of the two series in the past 15 years. Data on wages and salaries in the NIPAs currently has overall wage growth in calendar year 2020 at 0.2 percent. The NIPAs are subject to revision, especially the fourth quarter because the underlying data from the Quarterly Census of Employment and Wages (QCEW) for that quarter isn’t available until May. We posted recently that it doesn’t seem likely at this point that NIPA wages for 2020 will be revised significantly and that we expect the full year growth rate to be close to 0.
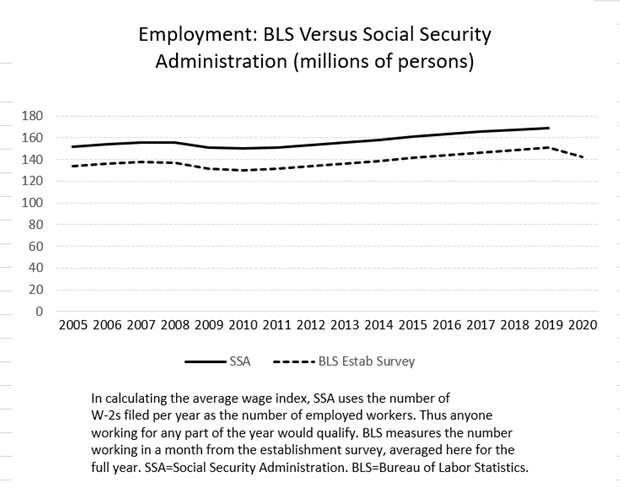
The big uncertainty this year for the AWI calculation is how many employees get counted for 2020. Most all workers who worked any part of 2020 receive a W-2 from their employer and get counted as an employed person for purposes of the AWI calculation. If you worked just one week in 2020, you may not have felt very employed for the year, but you would get counted as employed for SSA’s purposes of calculating the AWI, and that is important. Employment growth in the monthly establishment survey of the Bureau of Labor Statistics–the big employment report released the first Friday of every month that moves financial markets–tends to pretty closely track employment growth as tabulated by SSA from the W-2s (see chart below). The question becomes whether 2020 will be different because the pandemic-related shutdowns didn’t hit until March–meaning that even people who became long-term unemployed starting in March would be counted as employed for AWI purposes. In 2009 employment measured by SSA for AWI purposes did not drop as much as employment in the establishment survey. Indeed, the 2.9 percent drop in SSA-measured employment in 2009 was the most since data are available back to the mid-1970s. The timing of the 2009 recession was also different than the 2020 recession, as the previous recession began effectively in 2008, so some workers could have entered 2009 as unemployed and remained so for the entire year. That means that the difference between SSA- and BLS-measured employment could certainly be much larger in 2020 than in 2009.
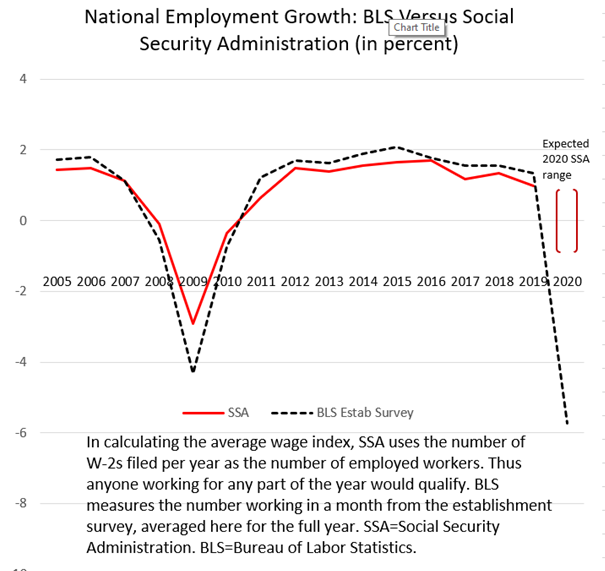
I’m inferring that Stephen Goss and CBO don’t expect employment for AWI calculation purposes to fall in 2020, unlike the standard employment measures such as averages from the establishment survey. Stephen Goss back last summer in his testimony was assuming a 1 percent drop in employment below the amounts expected in the 2020 Trustees Report, which I don’t believe is specified but I infer based on past movements in such employment means he revised his expectations for 2020 employment for AWI purposes to be close to flat in 2020 at near 2019 levels. I infer that the Congressional Budget Office has been using something more like a 0.8 percent increase in employment for AWI purposes. (I infer that from CBO’s February 2020 projection of 0.3 percent increase in NIPA wages and salaries for 2020 and a 0.5 percent decline in the AWI–so a 0.8 percent implied employment growth–and a July 2020 projection of a 3.1 percent decline in NIPA wages and salaries and a 3.8 percent decline in the AWI, for a similar implied 0.7 percent increase in employment.) Those projections, between flat and a 0.8 percent increase in employment for AWI purposes, are quite different from what BLS is estimating using its different concept of employment. I have bracketed the range of an increase of 0.8 percent to–what I consider more likely for a range–a drop of 1 percent in the chart above.
It seems very uncertain how many people worked for just a short portion of 2020, rather than not working at all and thus dropping out of the SSA measure for AWI purposes. That has critical implications for the AWI calculation for 2020. SSA always measures more people than BLS as a result of workers working only part of the year, such as summer or other temporary workers (see chart below). In 2019, there were about 18 million more workers working part of the year than an average annual measure of monthly totals from BLS. Did most of those 18 million continue to work at least a part of 2020? That seems to be the view of the experts. It seems clear that many workers were temporarily furloughed in 2020, or worked at the beginning of the year before becoming long-term unemployed, in either case being counted in SSA’s employment measure but reducing BLS’s measure. But there seems to be some possibility that many people who normally work just a part of the year worked at no time in 2020, such as normal summer workers who had no work opportunities in 2020 or part-time working women who had to stay at home with school-age children and couldn’t find at-home working opportunities. I see a possible one-sided movement in the AWI outside of my expected range: I don’t think we can rule out a bigger drop in SSA-measured employment than just 1 percent. For example, a 3 percent drop in employment for AWI purposes, like what was experienced in 2009, when combined with aggregate wages being roughly flat in 2020, would put the AWI change in 2020 much closer to the increase of recent years.